Modules
MechaData
This structured interface enables users to manage complex quantum chemical data with clarity and flexibility, supporting advanced workflows for thermochemical analysis and kinetic modeling in a research context. The graphical user interface (GUI) is shown in Figure 1.
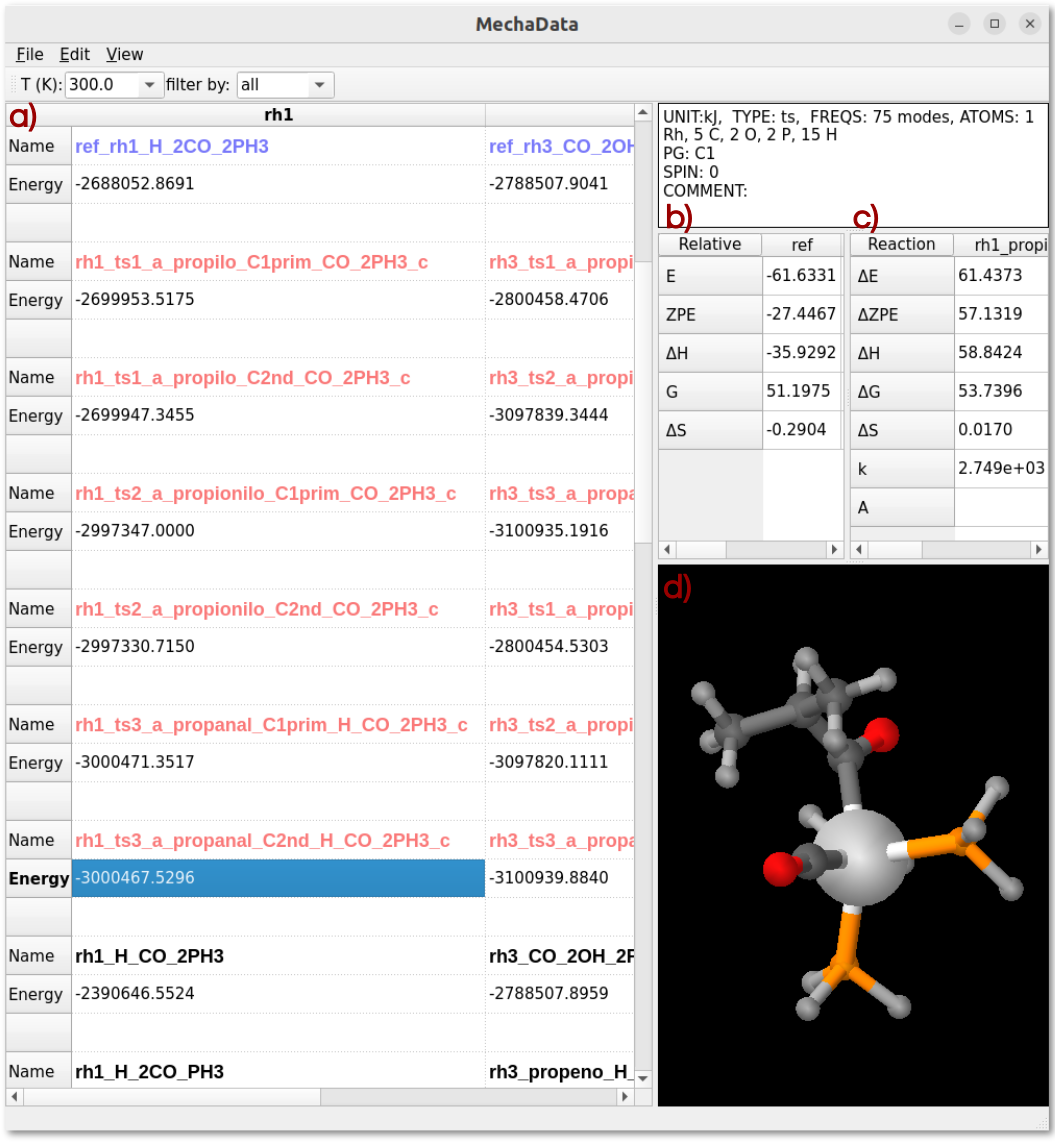
Figure 1. MechaData interface. a) Main spreadsheet for organizing reaction mechanisms. b) Relative energy panel and c) reaction energy panel. d) Embedded visualizer for molecular structures.
MechaData distinguishes itself through several design and functional advantages. Its key strengths include:
– Spreadsheet-like interface: The column-based layout allows users to organize entire mechanisms, with each column representing a reaction mechanism (Figure 1a). This design offers a user-friendly interface that facilitates the analysis of reaction pathways, allowing users to focus their effort not on deciphering raw data, but on interpreting the underlying chemical processes and gaining meaningful mechanistic insight.
– Automatic reference energy calculations: The reliable generation and comparison of reaction pathways depend on the precise calculation of relative energies based on appropriate reference species (Figure 1b), a procedure that is often laborious and susceptible to human error. One of MechaData’s most distinctive features is its ability to automatically compute relative energies for all intermediates, aligning them to user-defined reference states. This reduces manual effort and ensures consistency across large datasets.
– Built-in thermochemical tools: Vibrational frequency data can be scaled, edited, and directly used to calculate entropies, enthalpies, and Gibbs free energies. The platform seamlessly supports post-processing of this data, its visualization via integrated plotting tools, and its application in microkinetic modeling, enabling users to transition effortlessly from thermochemical calculations to kinetic analysis.
– Integrated visualization: As another unique feature of MechaData, molecular struc-tures can be visualized directly within the interface (Figure 1d) or in the advanced MechaEdit module. This functionality enables users to easily inspect the system states at each step of the reaction pathway without the need to manage multiple geometry files or relying on external visualization packages. Such accessibility provides an intuitive, researcher-oriented experience that prioritizes the mechanistic understanding over manual file handling.
– No programming required: Unlike many comparable tools, MechaData provides a fully featured graphical user interface (GUI, Figure 1a-d), requiring no coding knowledge and making the platform accessible to a broader community of chemists, including experimentalists seeking mechanistic insights. At the same time, users who prefer to work programmatically can export the mechanisms in JSON, allowing further customization or integration into computational workflows. Also, the post-processed data can be easily exported in structured formats (csv and xlsx files), facilitating reproducibility, data sharing and further analysis.
– Direct plotting of free energy profiles: A key innovation of MechaData is its ability to generate free energy diagrams directly from the organized data, without the need for external plotting tools. This enables both reproducibility and customization as the diagrams can be visualized and readily adjusted (including style, formatting, labels and layout) before being exported as high-quality images using the Matplotlib python library.
User interface and functionality
The GUI of MechaData is designed to facilitate the setup, execution, and analysis of reaction network simulations through an intuitive, user-centric layout. It combines spreadsheet-style controls with interactive visual tools, while the menu structure is organized into logical categories for data management, visualization, plotting, and mechanistic editing. This section provides an overview of the main components of the GUI and describes the functionality of the available menus.
File Menu
All the options available in MechaData file menu are shown in Figure 2, and main functionalities are described below.
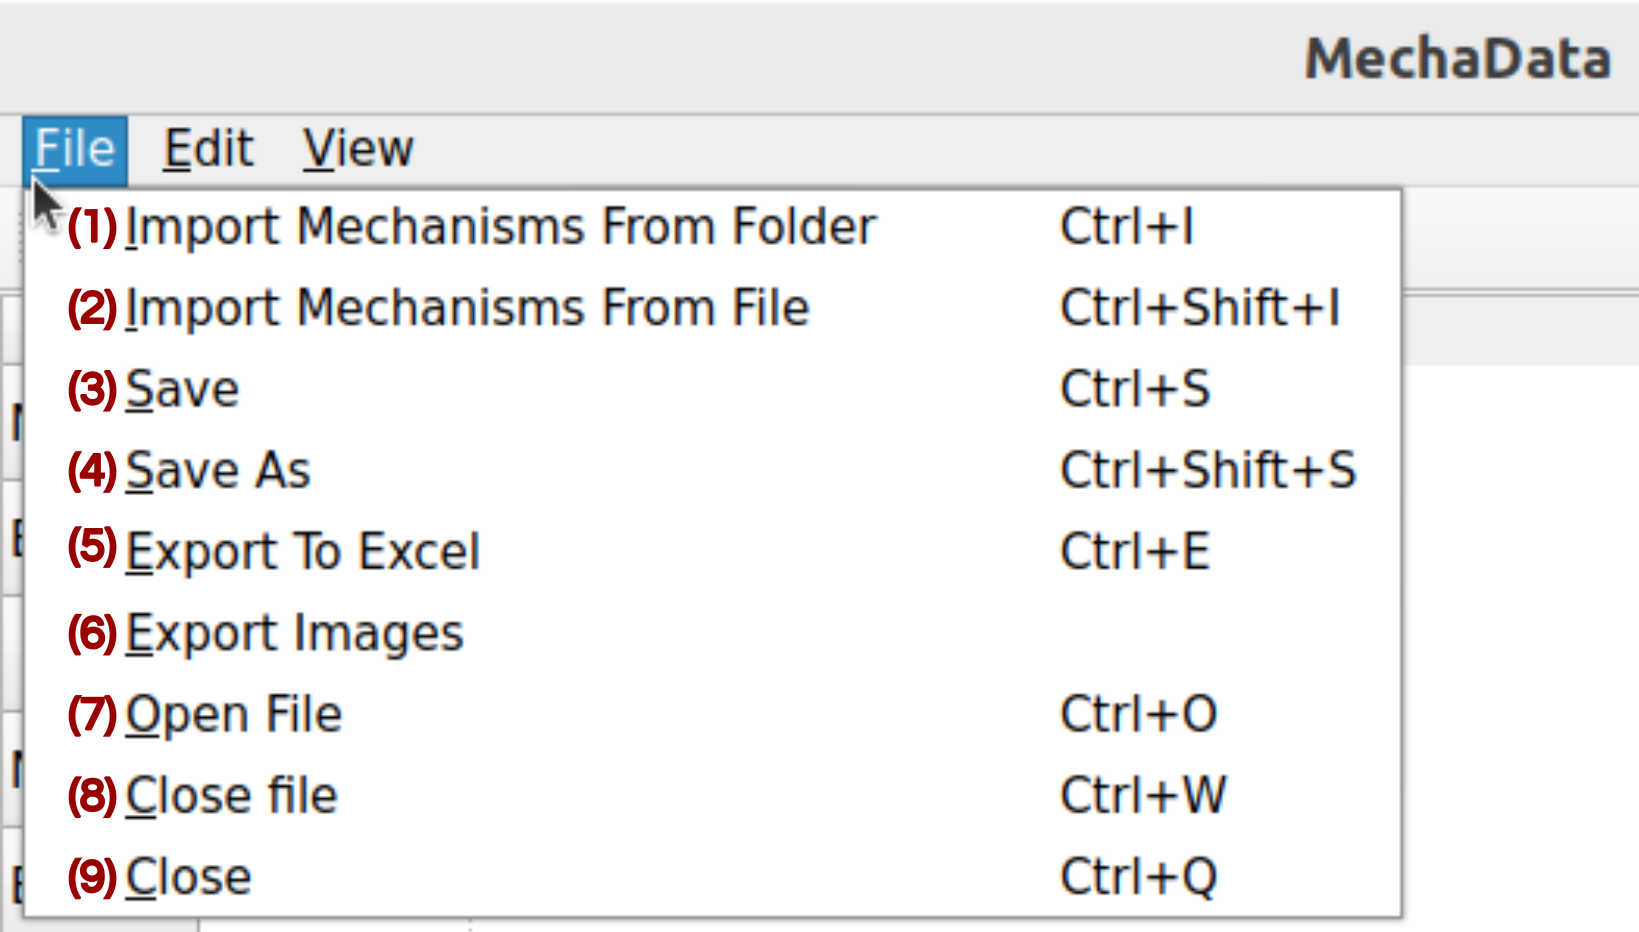
Figure 2. File menu in MechaData GUI.
(1) Import Mechanism From Folder: Loads a reaction mechanism from a directory containing several folders (one per calculation) with quantum chemical output files. MechaSuite automatically extracts relevant thermochemical and structural data for each intermediate and transition state. It is advisable to run the preprocessing scripts first, to ensure the QM software and filenames are set properly.
(2) Import Mechanism From File: Loads a reaction mechanism from a JSON file to the selected mechanism (column).
(3/4) Save / Save As: Saves the current workspace as a JSON file, including all mechanisms, structures, references, and calculated data. Useful for preserving project state.
(5) Export to Excel: Exports the reaction data sheet to an Excel file for external analysis or reporting.
(7-9) Open / Close: Opens an existing mechanism project or closes the current workspace.
Edit Menu
MechaData edit menu is shown in Figure 3, with corresponding description below.
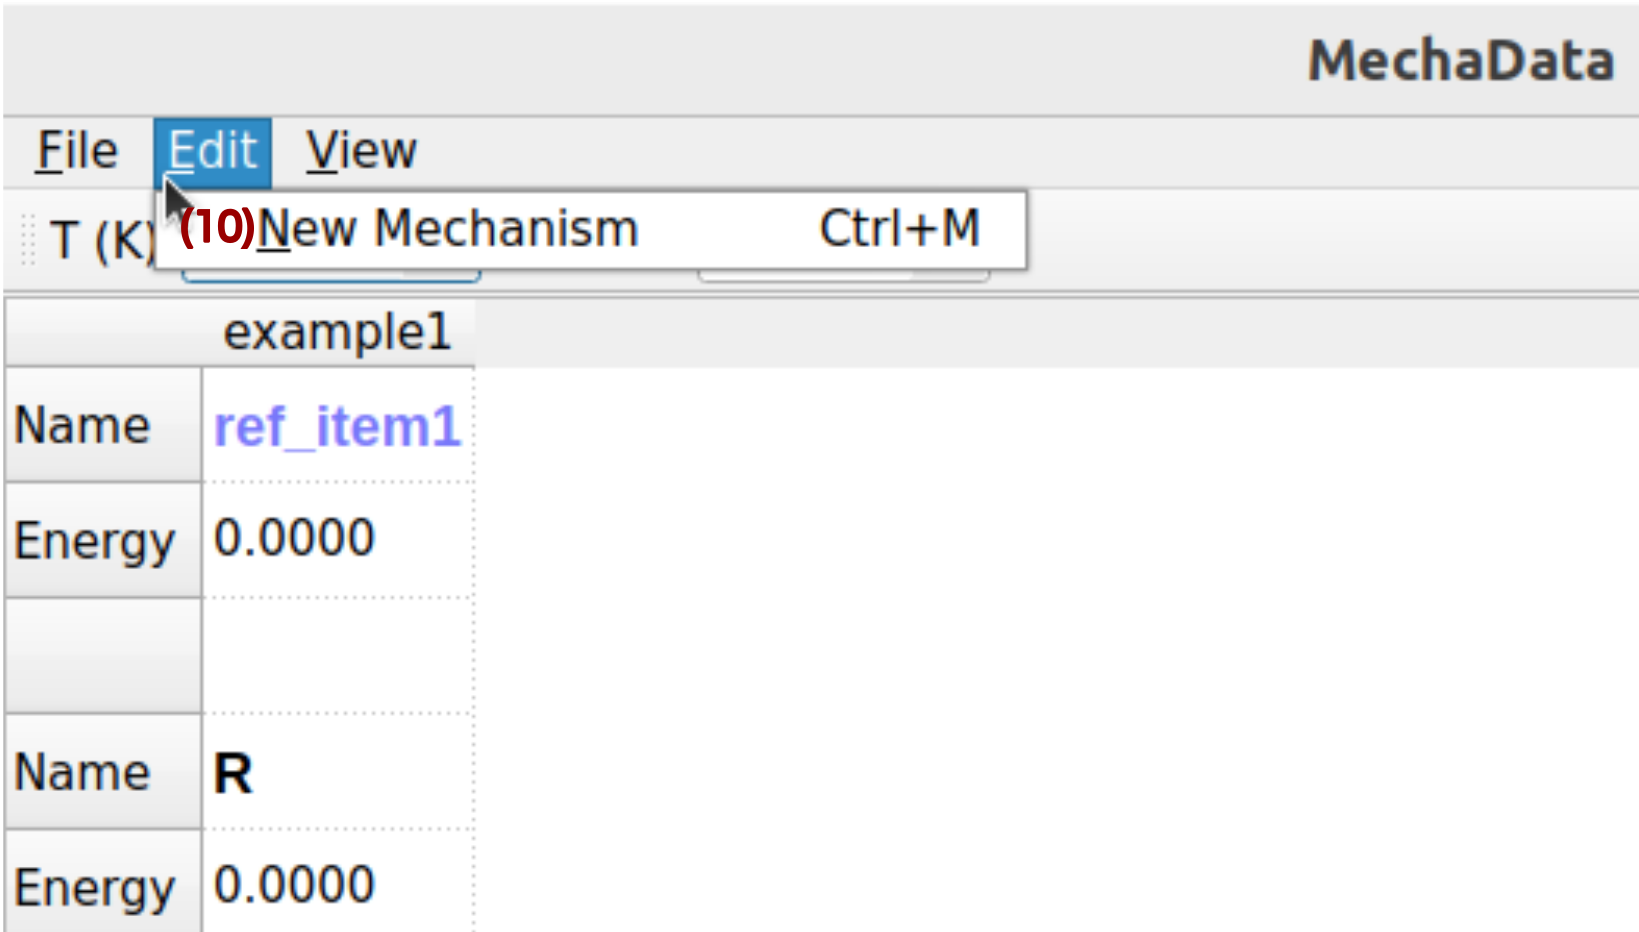
Figure 3. Edit menu in MechaData GUI.
(10) New Mechanism: Creates a new reaction mechanism column within the workspace. Each column represents an independent mechanism and serves as a container for intermediates, transition states, and references.
View Menu
MechaData view menu is shown in Figure 4, with corresponding description below.
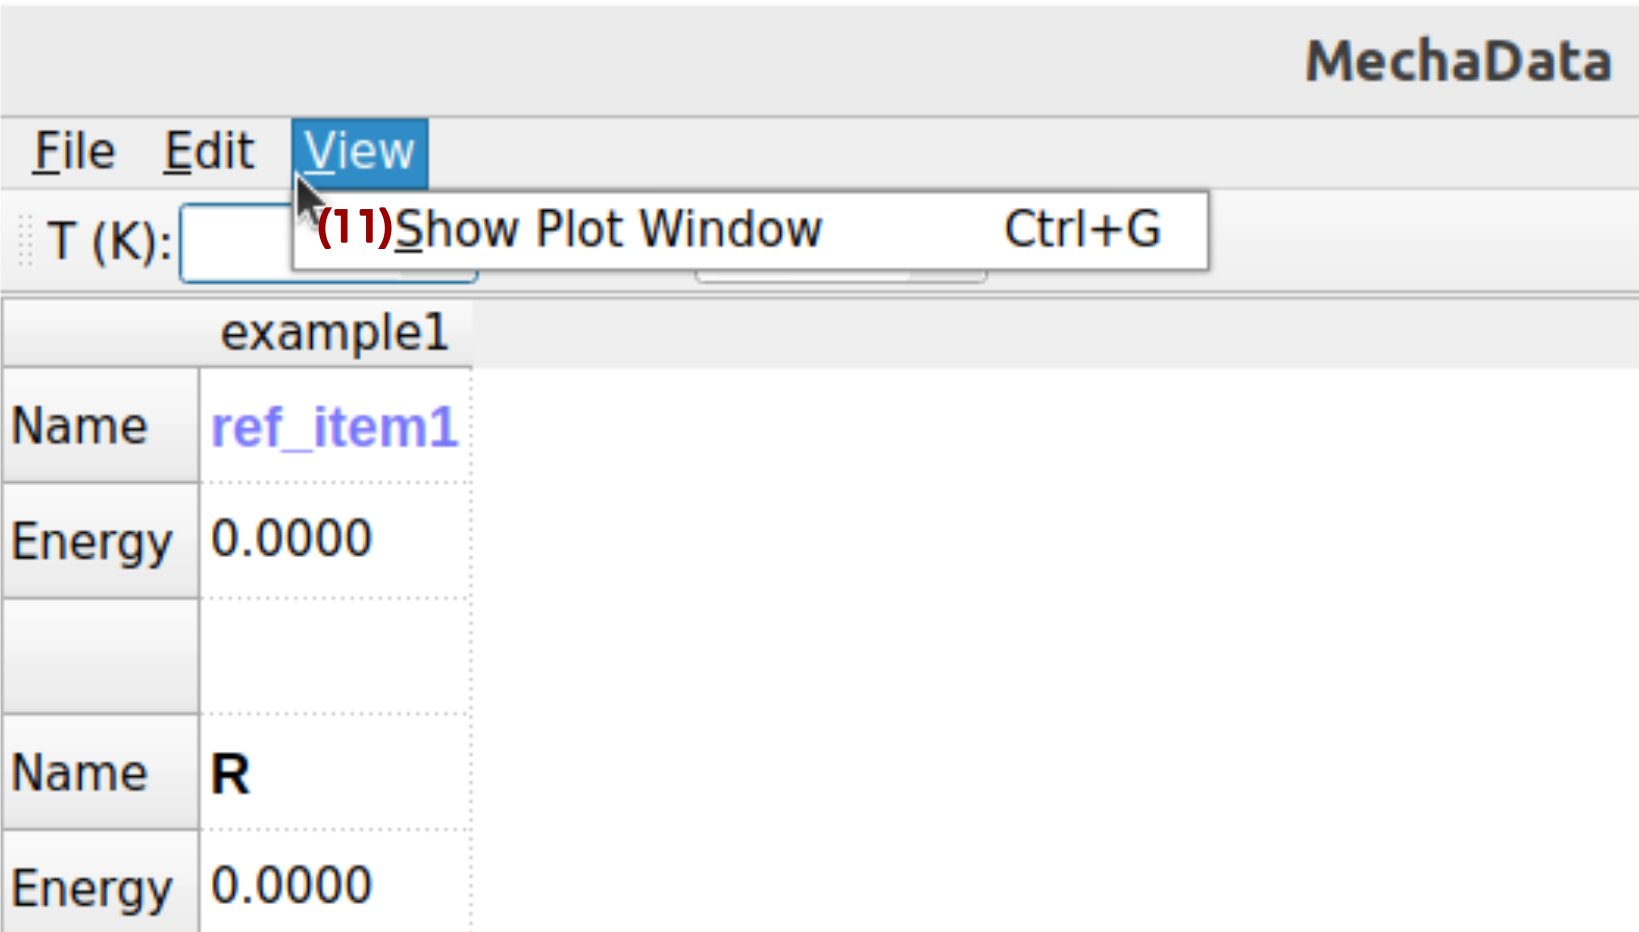
Figure 4. Edit menu in MechaData GUI.
(11) Plot: Generates plots of energy profiles or kinetic trends based on the currently selected mechanism and data. Users can visualize free energy diagrams, reaction coordinates, or custom thermodynamic plots.
Data filters
Results imported in MechaData can be filtered by different criteria, as illustrated in Figure 5.
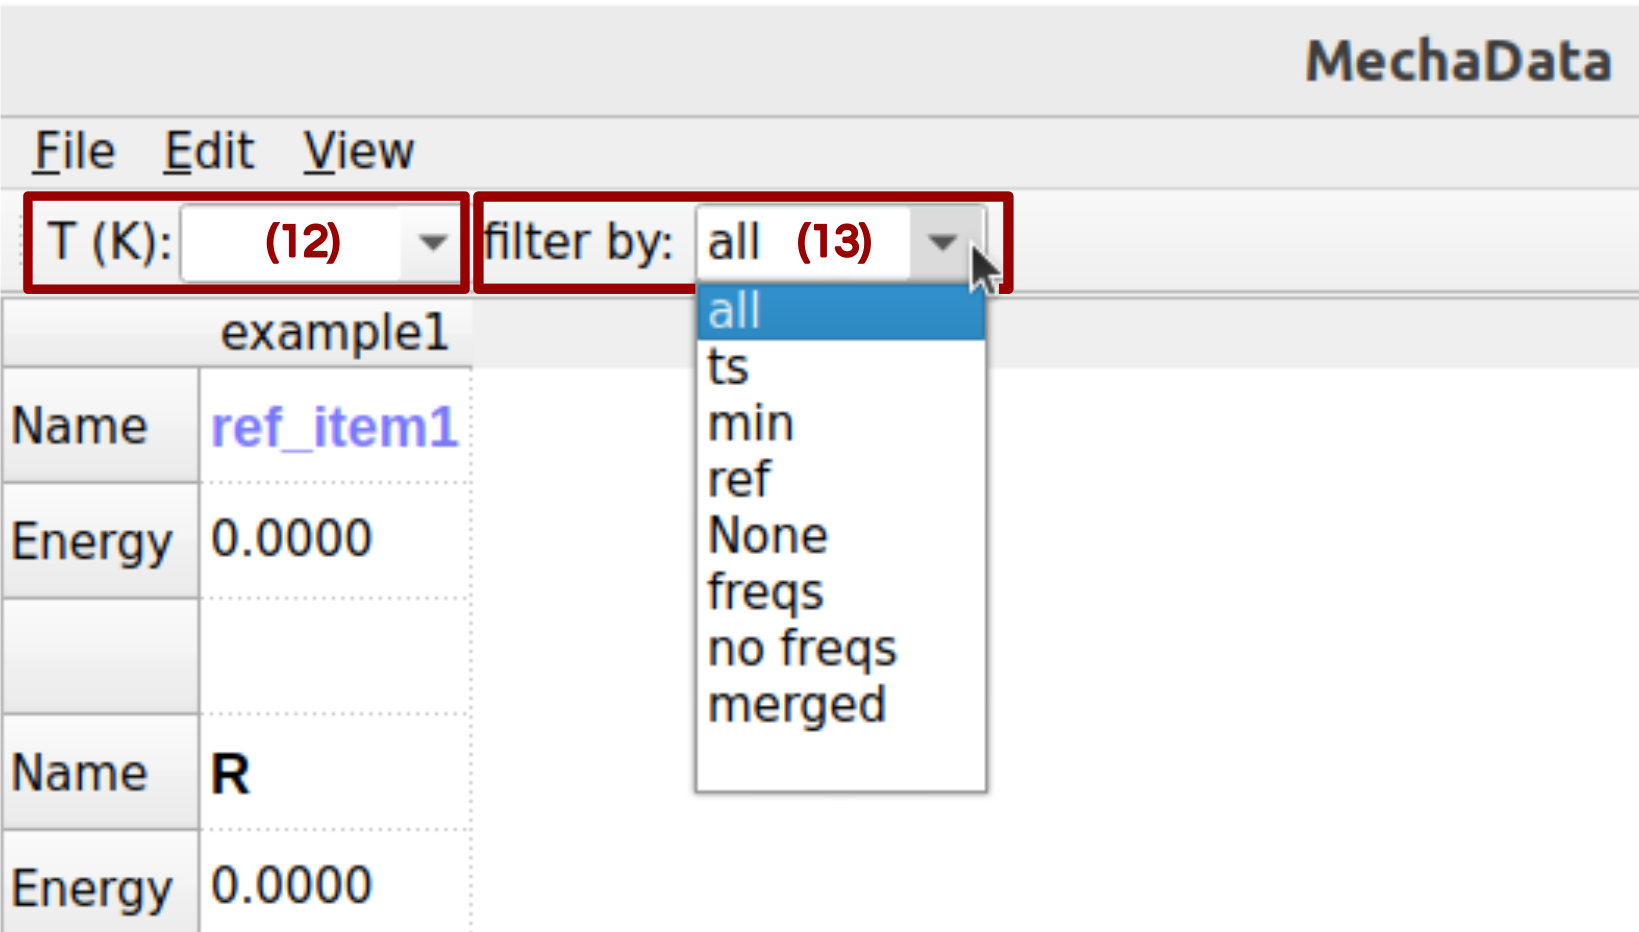
Figure 5. Data filters in MechaData GUI.
(12) Set temperature: Sets the temperature of the values shown in the relative energy panel (Figure 1c) and reaction panel (Figure 1d).
(13) Filter by: Filter the items shown in the spreadsheet.
Right-Click Options on Columns (Mechanism-Level Controls)
Several options are shown when right-clicking on a given column (options 14–22 in Figure 6).
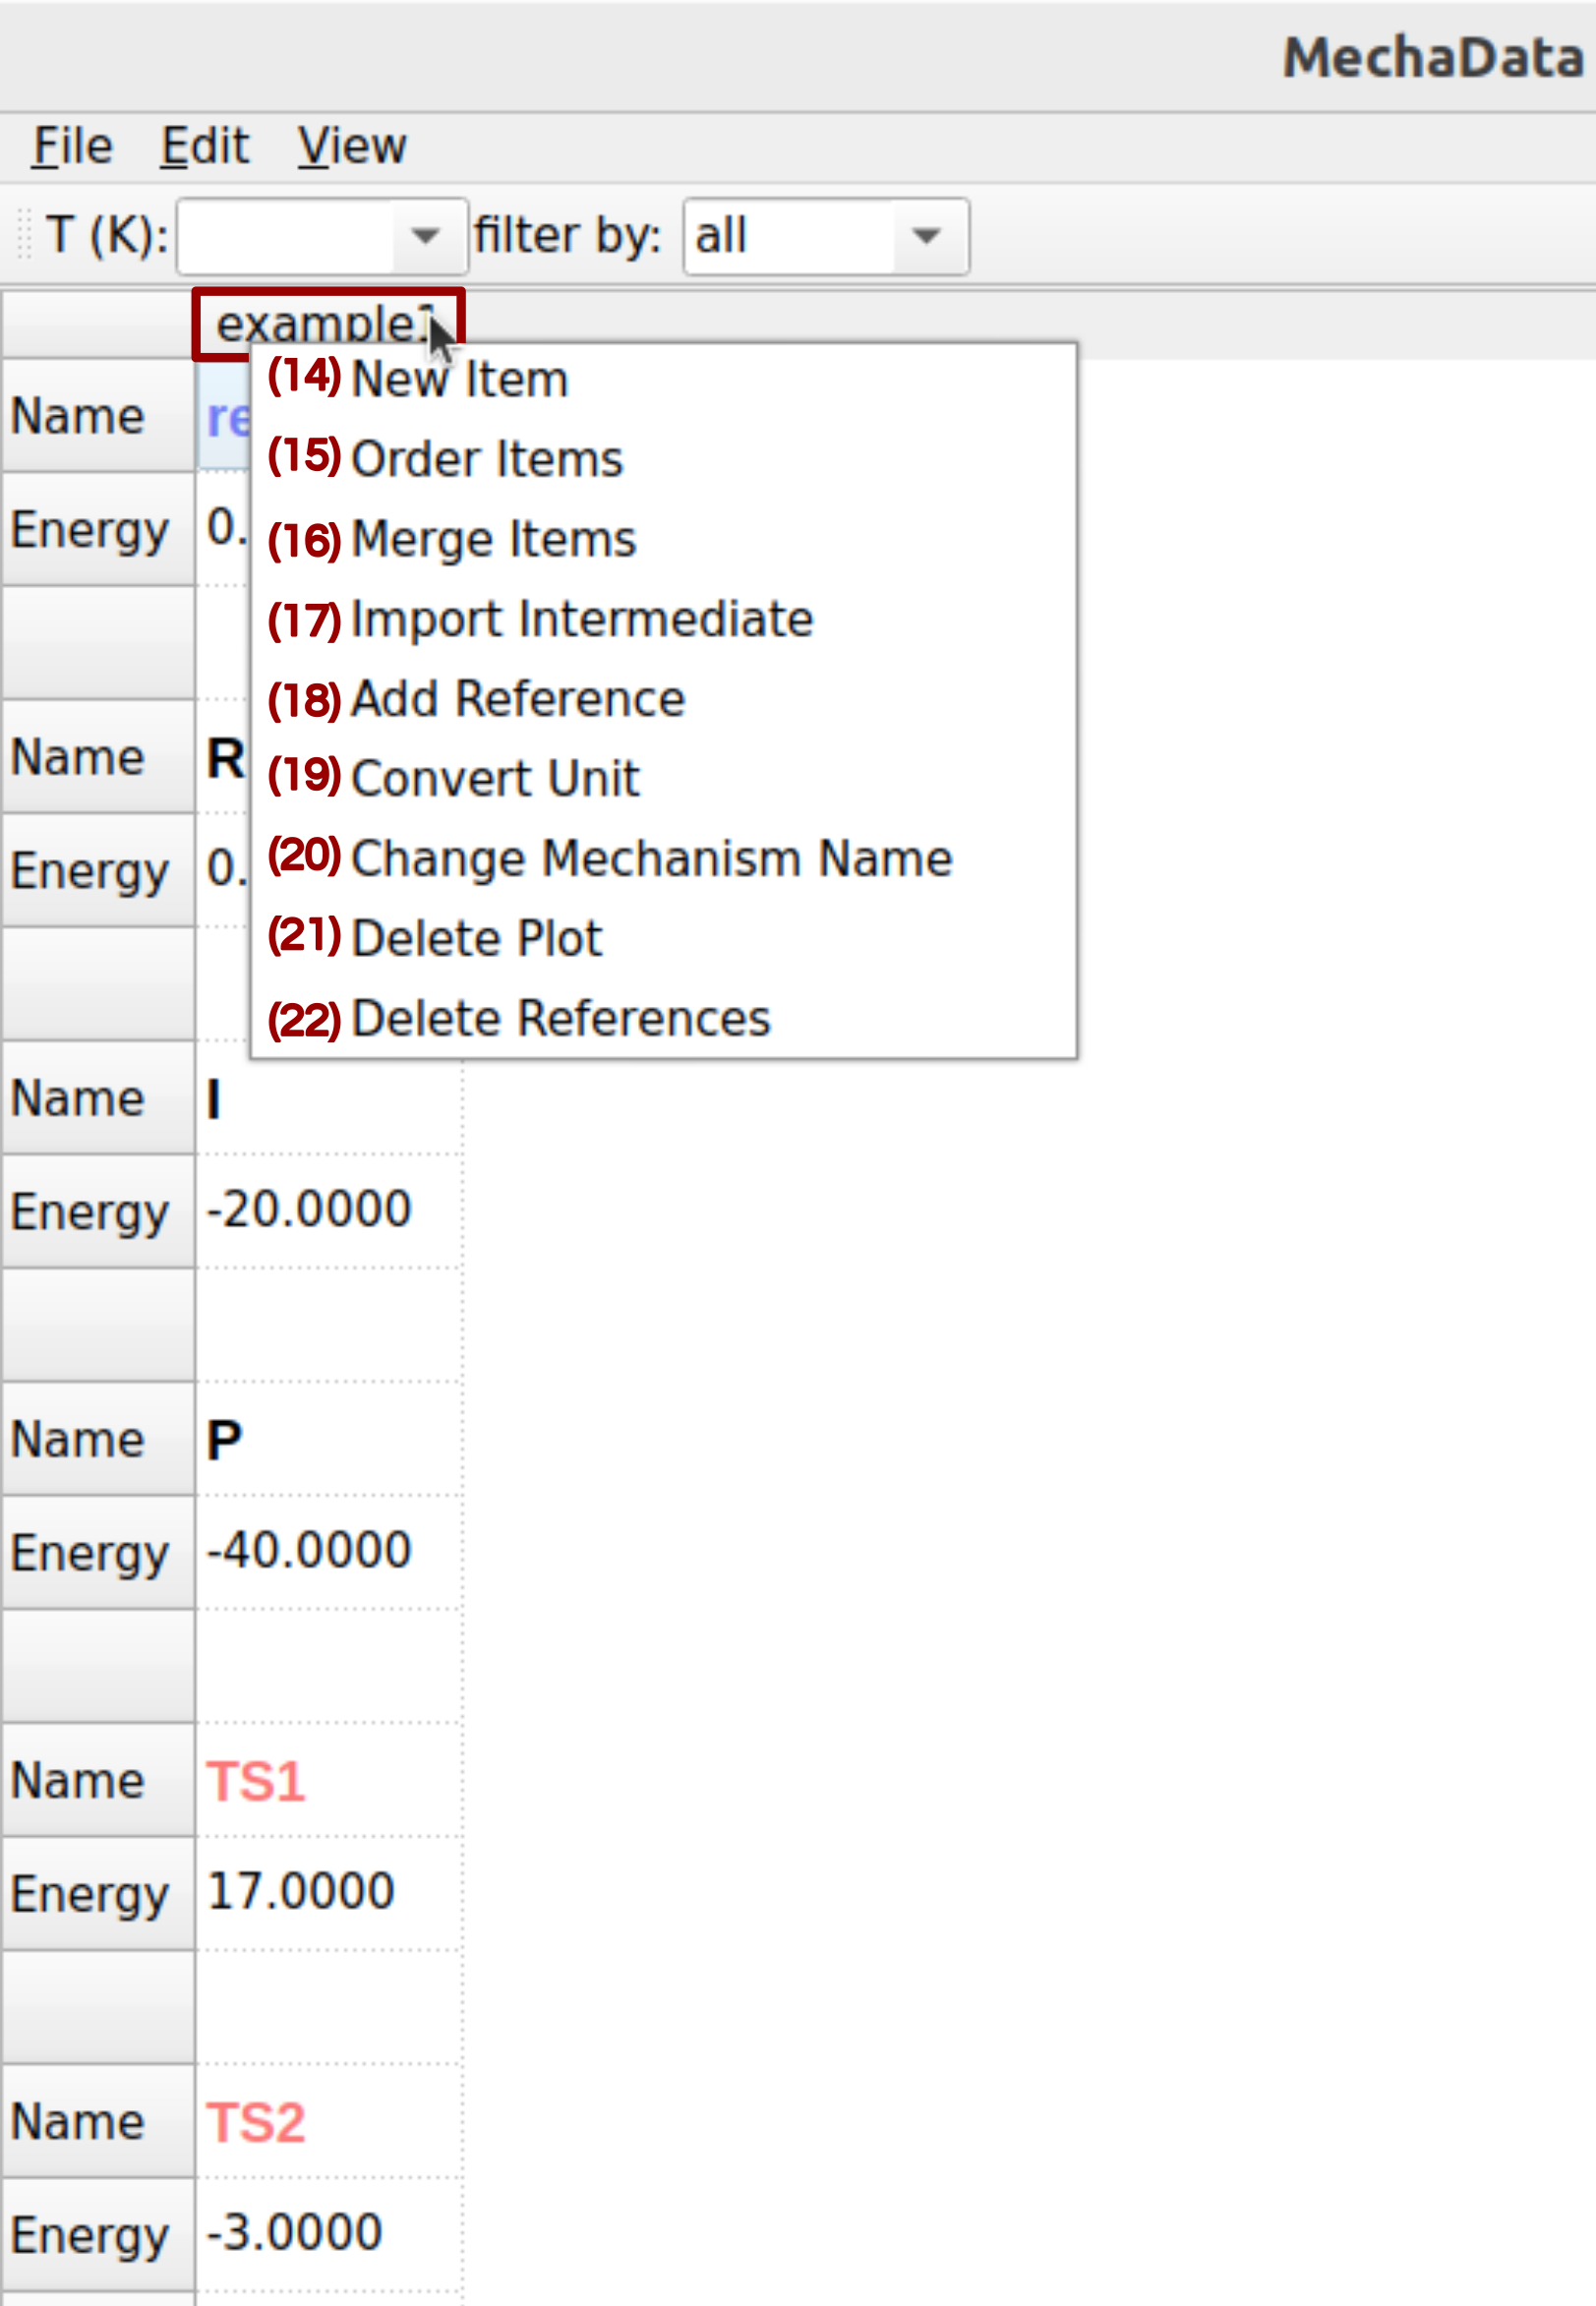
Figure 6. Right-click options on columns in MechaData GUI.
(14) New Item: Adds a new row to the current mechanism for a structure, intermediate, or transition state.
(15) Order Items: Change the order of the items in a column.
(16) Merge Items: Merges intermediates to simplify the mechanism representation.
(17) Import Intermediate: Adds new species to the mechanism by importing them from external quantum chemical output.
(18) Add Reference: Adds a new energy reference by combining several reference items.
(19) Convert Units: Converts energy units (e.g., Hartree to kJ/mol) across the mechanism for consistency.
(20) Change Mechanism Name: Renames the mechanism column.
(21/22) Delete Plot / Delete References: Removes specific plots or reference entries from the mechanism.
Right side panels
The right side of MechaData interface presents several panels with important information about the system and relative energy values (Figure 7).
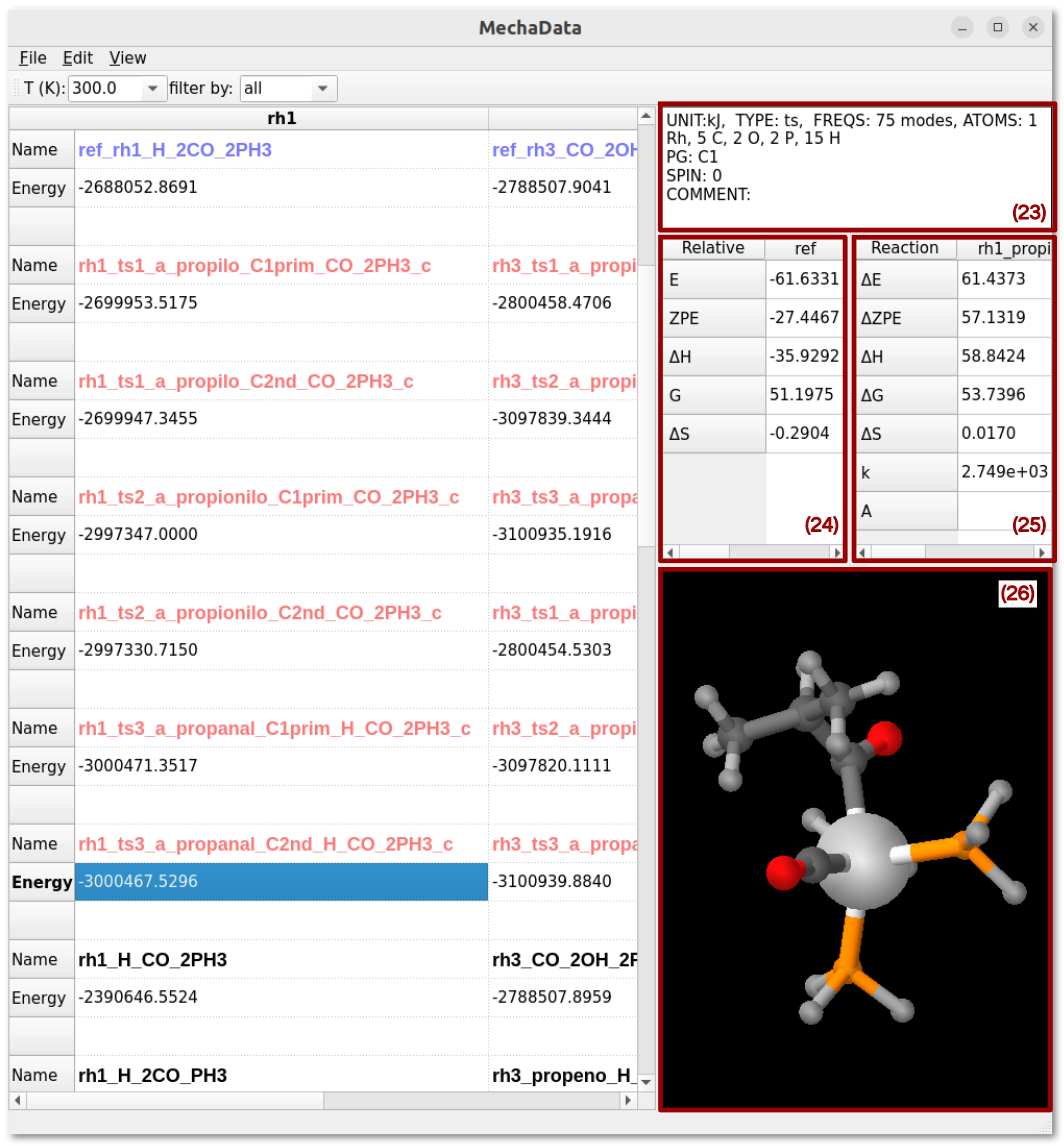
Figure 7. Right-click options on rows in MechaData GUI.
(23) System Information: summarizes important information about the selected item, such as the energy unit, type of calculation, number of vibrational frequencies, number of atoms, symmetry and total spin moment set for the calculation, as well as a comment set by the user.
(24) Relative Energy Panel: Display the calculated relative quantities, such the energy (E), zero point energy (ZPE), enthalpy (ΔH), Gibbs free energy (ΔG) and entropy (ΔS), for the selected item at a given temperature.
(25) Reaction Panel: Display calculated quantities for a given reaction, such as the reaction energy (ΔE), ZPE-corrected reaction energy (ΔZPE), reaction enthalpy (ΔH), reaction Gibbs free energy (ΔG), reaction entropy (ΔS), reaction rate constant (k) and pre-exponential factor (A) from TST theory.
(26) Structure Vizualizer: Integrated geometry visualization for efficient inspection and validation of computed structures.
Right-Click Options on Row Entries (Species-Level Controls)
Several options are shown when right-clicking on a given row (Figures 8–10).
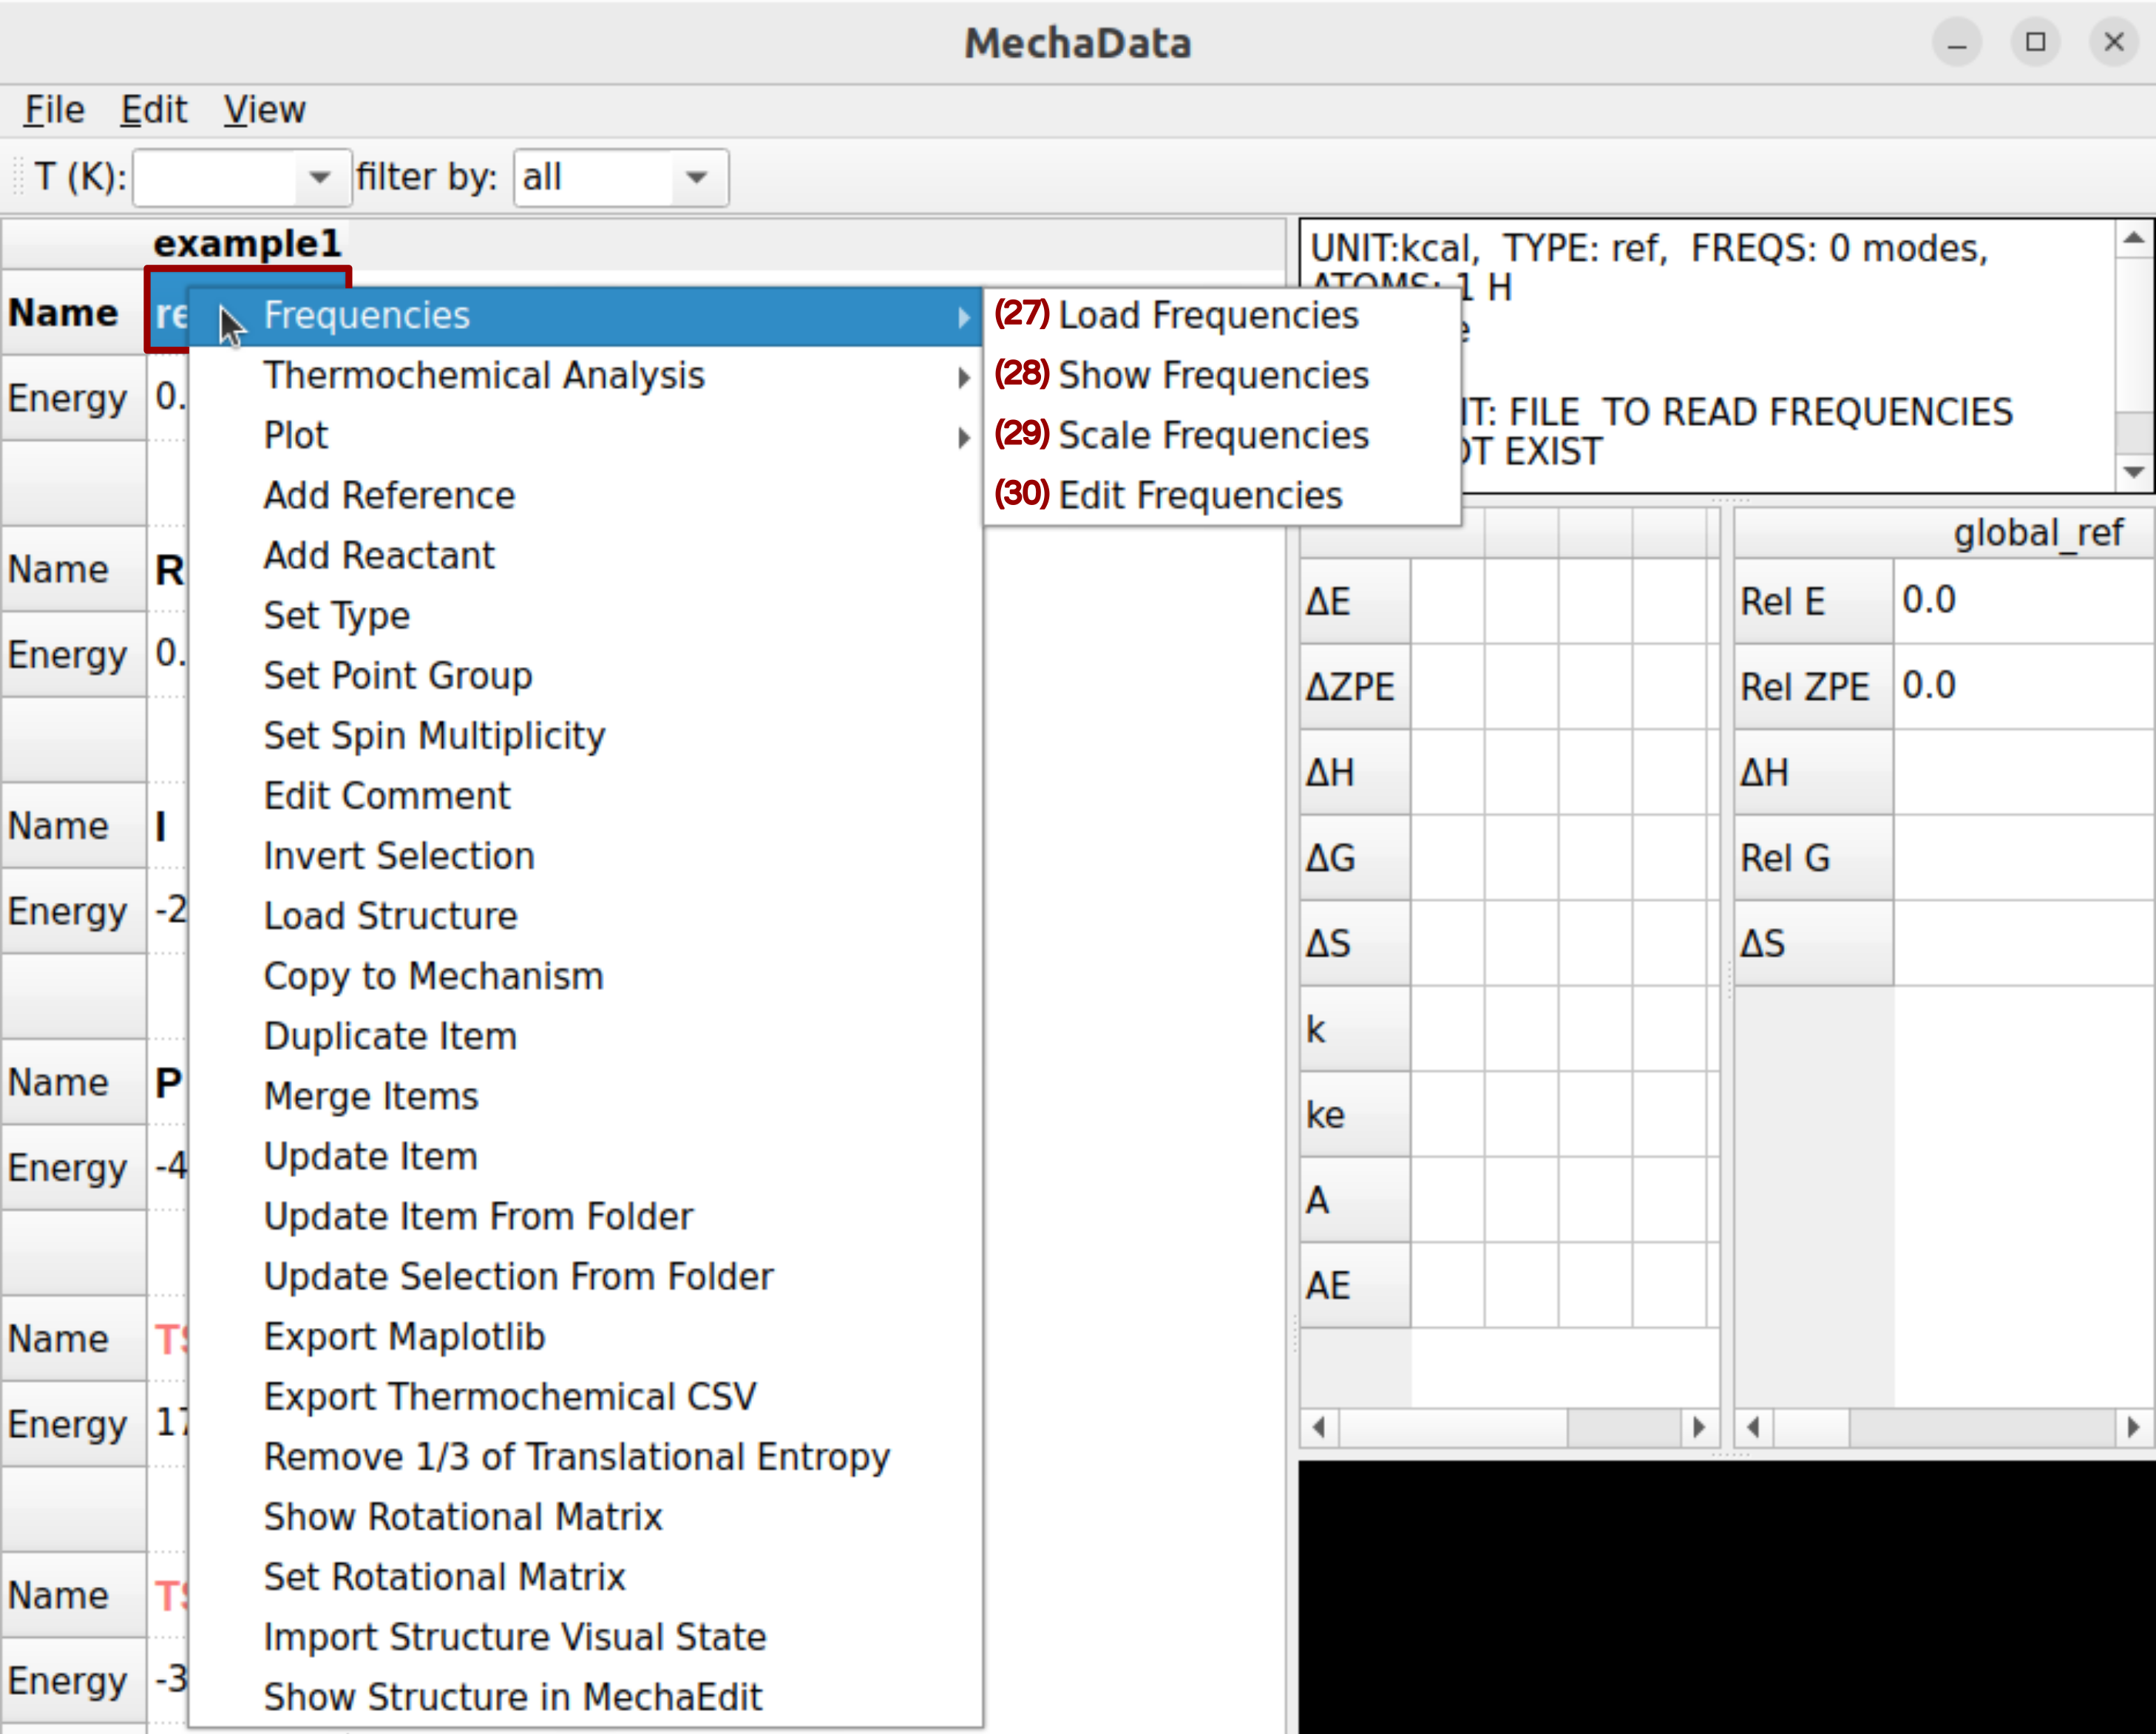
Figure 8. Right-click options on rows in MechaData GUI.
(27-30) Frequencies: Opens a panel to load, view, scale, or edit vibrational frequencies from quantum chemical calculations.
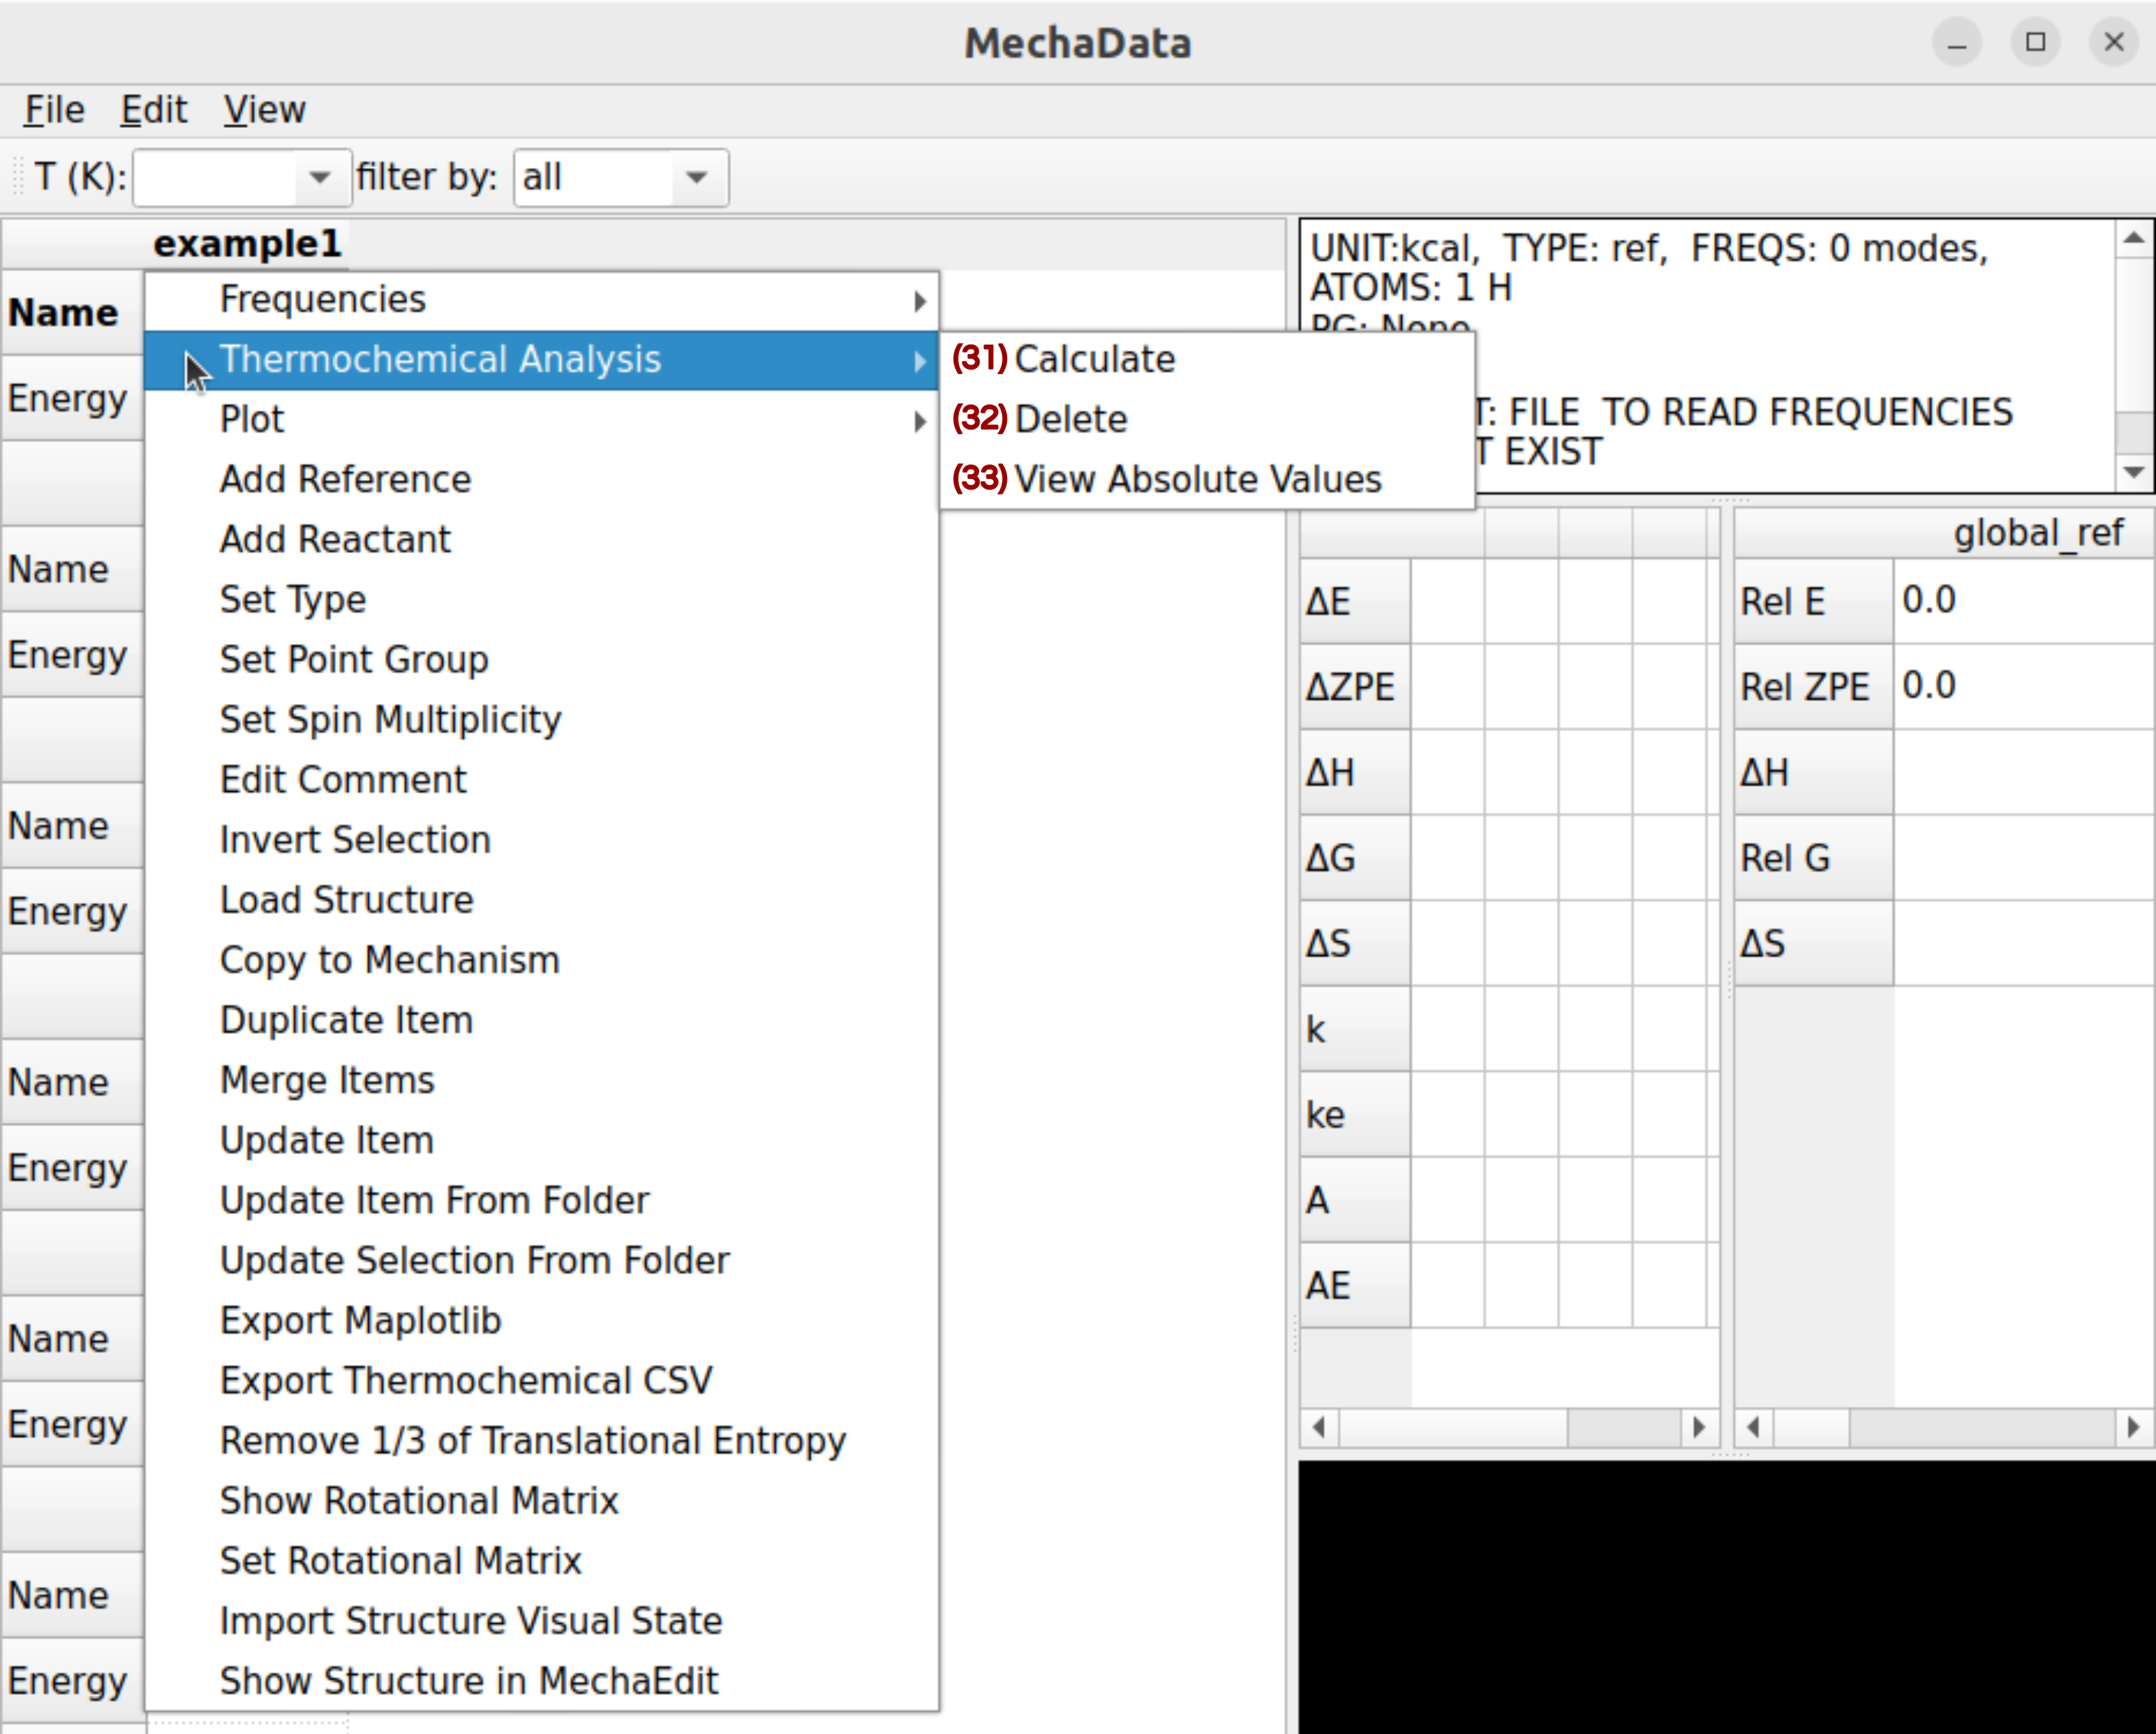
Figure 9. Right-click options on rows in MechaData GUI (continuation).
(31-33) Thermochemical Analysis: Computes thermodynamic parameters (G, H, S) based on vibrational and structural data.
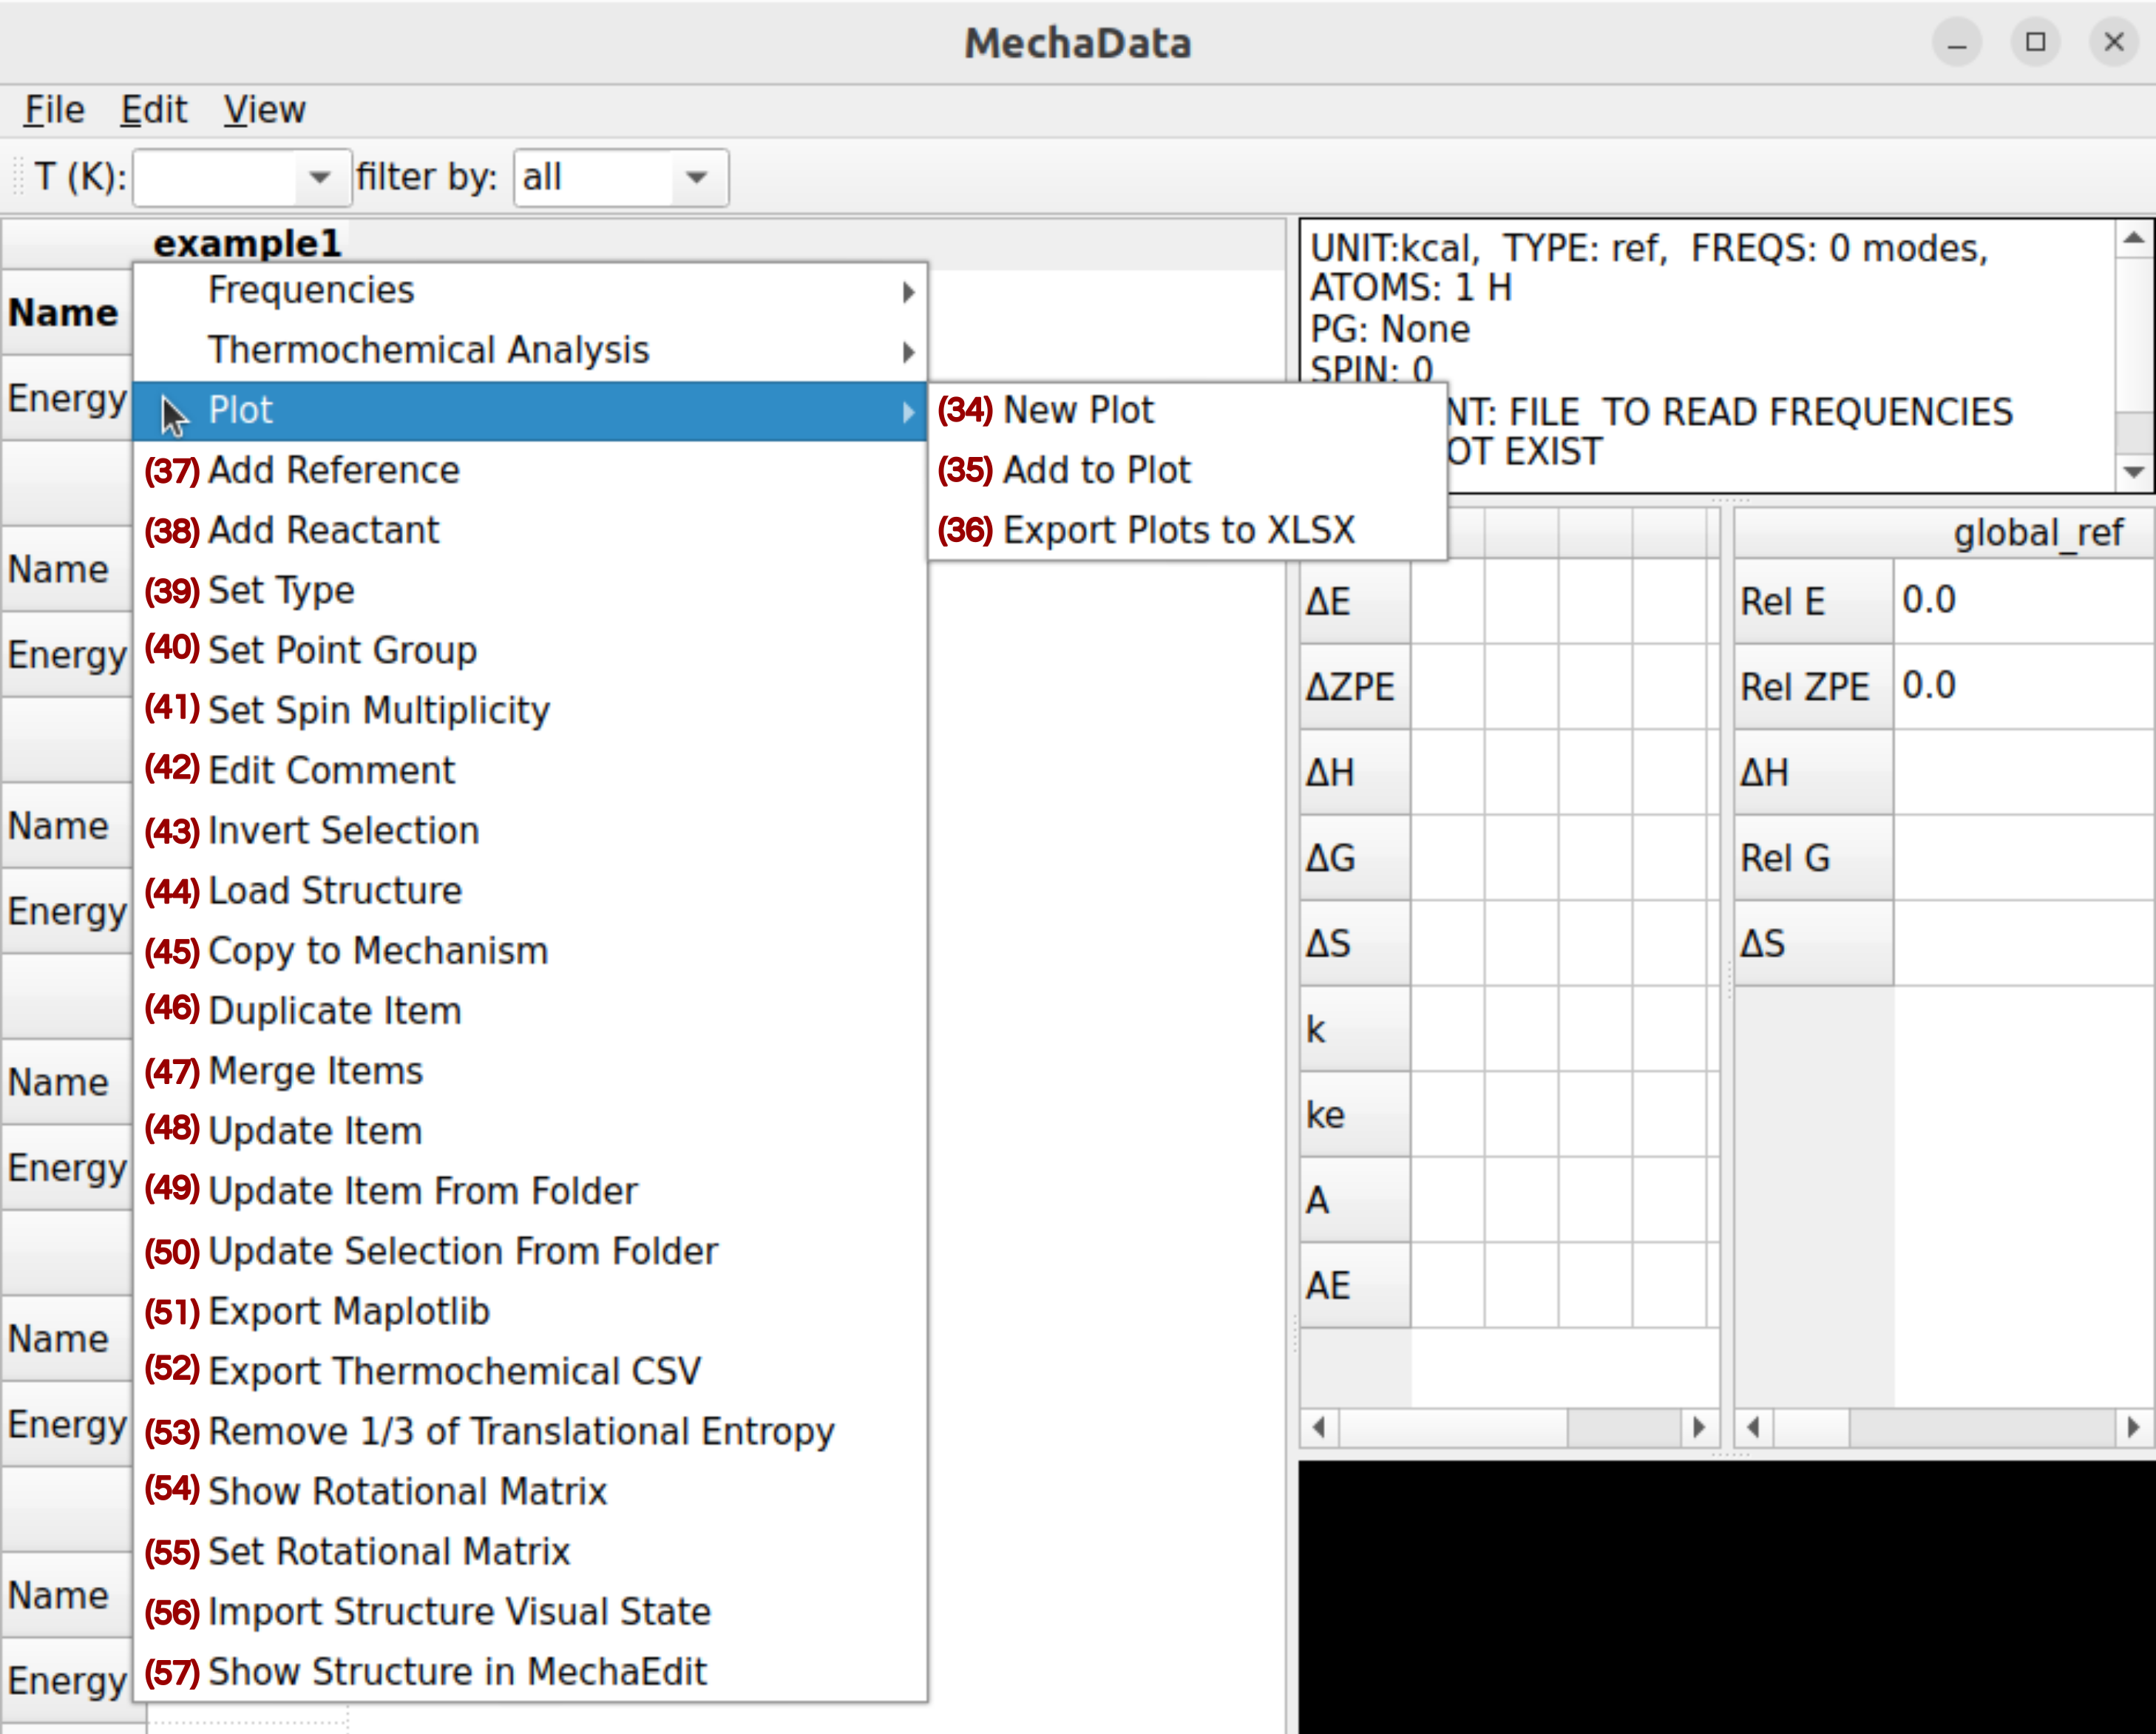
Figure 10. Right-click options on rows in MechaData GUI (continuation).
(34-36) Plot: Generates energy profiles or add selected intermediates to existing free energy profiles.
(37/38) Add Reference / Add Reactant: Designates the selected species as a reference or adds it as a reactant to the mechanism.
(39) Set Type (Minimum, Transition State, Reference): Categorizes the species for use in kinetics and visualization.
(40) Set Point Group: Assigns a symmetry point group, which may be used in entropy corrections.
(41) Set Spin Multiplicity: Assigns spin multiplicity for electronic entropy.
(42) Edit Comment: Adds or modifies user annotations for the species.
(43) Invert Selection: Toggles current selections. Useful for batch operations.
(44) Load Structure: Imports molecular geometry data from a file.
(45) Copy to Mechanism (Column): Duplicates the selected species into another column.
(46) Duplicate Item: Creates a copy of the current entry.
(47) Merge Items: Create a new intermediate by grouping individual intermediates or transition states. The effect would be to sum up individual energies.
(48) Update Item: Updates the calculation results, energy, geometry, vibrational frequencies, etc., from the calculation folder. The calculation folder must have the same name as the intermediate, and be located in the same working directory.
(49) Update Item From Folder: Updates the calculation results, energy, geometry, vibrational frequencies, etc., from the specified folder.
(50) Update Selection From Folder: Updates the calculation results, energy, geometry, vibrational frequencies, etc., from the specified folder. The folder must contain subfolders matching the names of the selected items.
(52) Export Thermochemical CSV: Saves thermodynamic data for the selected species to a CSV file.
(53) Remove 1/3 of Translation Entropy: Applies a correction often used for adsorbed species in surface chemistry (see C. Rzepa et al.: J. Phys. Chem. C 124, 16350 (2020))
(56) Import Structure Visual State: Modifies, for the selected items, the rotation matrix used to show the geometry in the embedded visualizer.
(57) Show Structure in MechaEdit: Opens the species in MechaEdit, the advanced structure editor, for detailed modification or inspection.
Calculation of relative energies
In the second example of the manuscript, the first three minima in every column, %(highlighted by the light hl{purple box in} Cref{fig:spreadsheet2}a) ethyl bromide, TBOH, and TBAF, are not directly involved in the reaction pathways but are used as reference species to compute the relative energies of all other intermediates. They form a basis to calculate the relative energies of all intermediates and transition states of a mechanism. A corresponding reference energy can be then calculated as a linear combination of the energies of these reference geometries (Equation ref{glob_ref}).
noindent Here, a, b, and c are coefficients automatically determined by mechadata through the solution of a system of linear equations. Subsequently, the relative energy of any structure $X$ ($textrm{E}_{rel}(X)$, Equation ref{rel_en}) is then computed by subtracting the reference energy ($textrm{E}_{ref}$, using Equation ref{glob_ref}) to the absolute energy of $X$ ($textrm{E}_{abs}(X)$).
In this example, we define an intermediate, denoted REACTANT, corresponding to the minimum-energy state preceding the SN2 and E2 transition states. REACTANT is constructed by merging two separate calculations, the geometry optimization of ethyl bromide and the optimization of TBAF microsolvated by 0, 1, 2, or 3 TBOH molecules. Consequently, the absolute energy of REACTANT is given by the sum of the energies obtained from these individual optimizations. For REACTANT without TBOH, the reference coefficients in Equation ref{glob_ref} are a=b=1 and c=0. These coefficients may vary depending on the atomic composition of each minimum and transition-state structure in the mechanism, ensuring that all energies remain comparable. For example, when textit{REACTANT} is defined by merging optimized ethyl bromide with optimized TBAF in the presence of one TBOH molecule, the coefficients become a=b=c=1. If two TBOH molecules are present, the coefficient c increases accordingly to 2.
Importantly, the reference coefficients associated with a given intermediate are independent of how the structure is generated, being identical whether the intermediate comes from a single optimization including all molecules or from merging individually optimized geometries.
By referencing every structure in the mechanism to this common basis and through the appropriate coefficients, all species can be consistently included within the same free-energy profile. This merging and referencing scheme provides a flexible definition of intermediates, avoids unnecessary additional calculations, and removes the need for manual coefficient assignment when computing relative energies. Moreover, because reaction and activation energies are evaluated relative to a common reference basis, overall energy consistency is inherently ensured.
MechaEdit
Although the basic geometry visualization capabilities are integrated into MechaData, MechaEdit is specifically designed for detailed structural analysis and editing. In addition to the menu bar (Figure 11a), the GUI is composed of a toolbar (Figure 11b), the main drawing canvas (Figure 11c), and a side panel (Figure 11d). The most relevant options are described below.
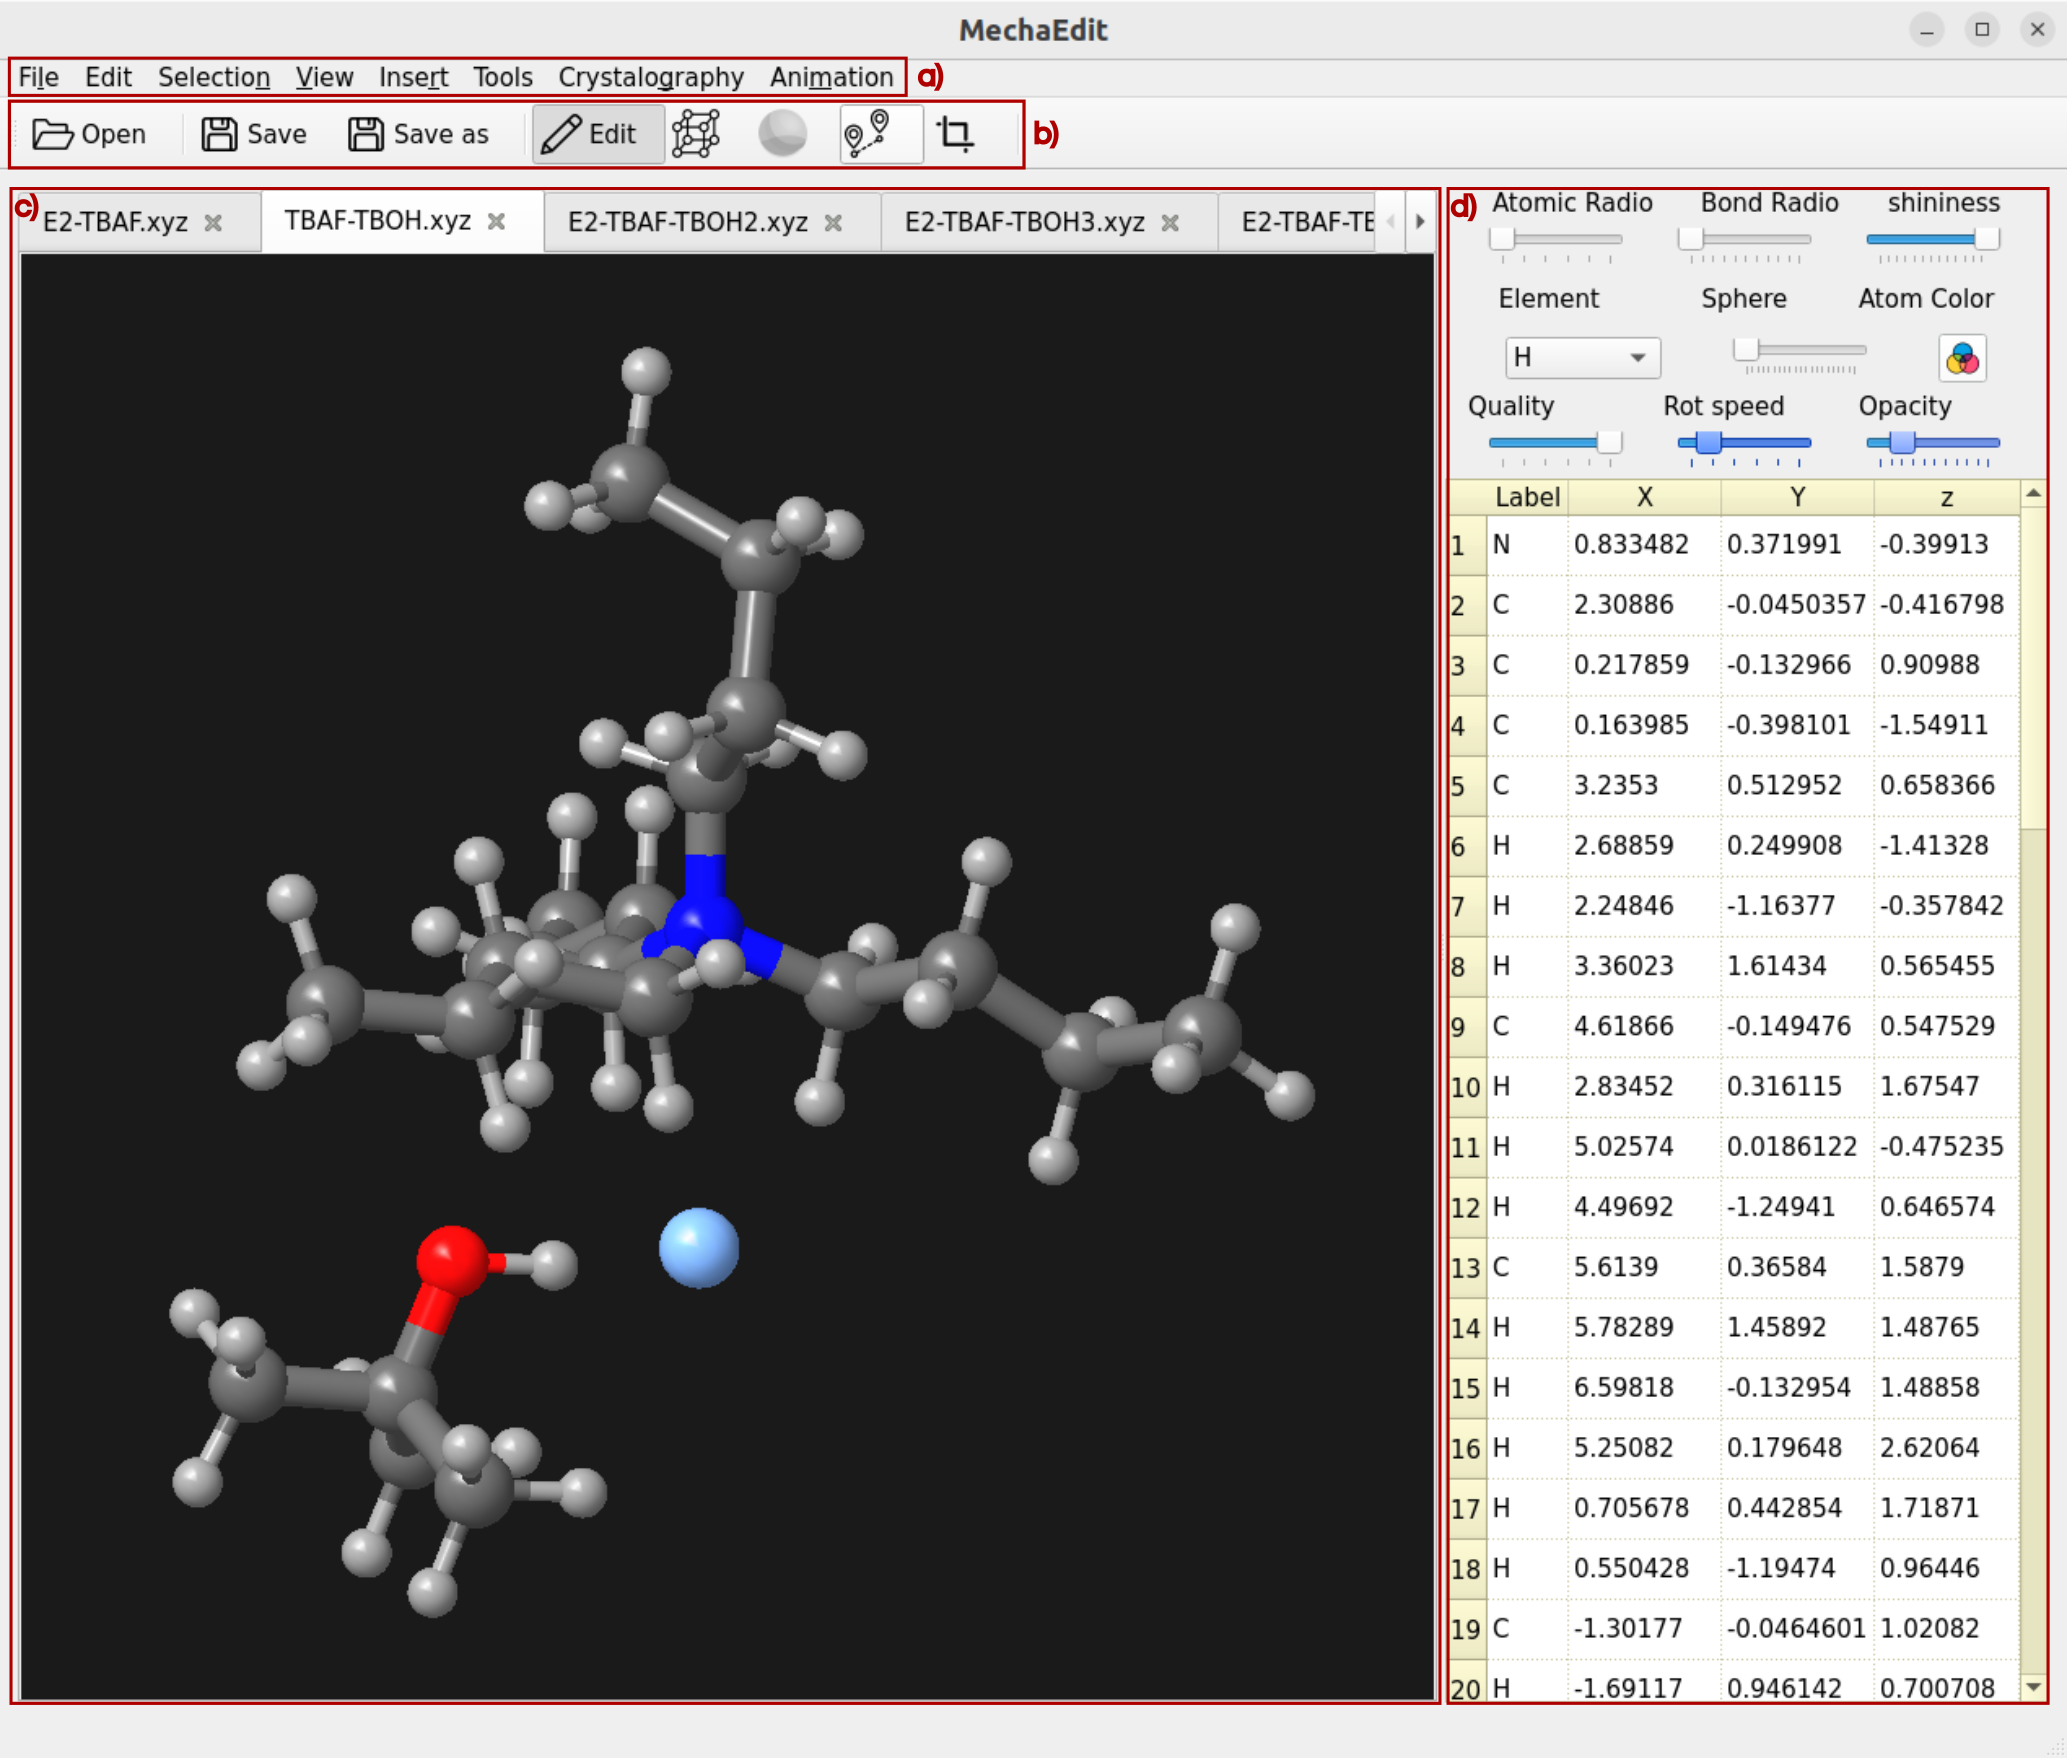
Figure 11. Overview MechaEdit GUI.
Toolbar
The following description corresponds to the functionality of the buttons in the Toolbar panel (Figure 11b).
– Open: opens a new geometry file.
– Save: saves the visualized geometry to the currently opened file with the same name.
– Save as: saves the visualized geometry to a different file.
– Edit: activates the edit mode, in which atoms that are selected can be dragged (while moving the cursor with the mouse left button clicked) or rotated (while moving the cursor with the mouse right button clicked).
– Lattice: toggles the visualization of the unit cell on or off.
– Specular: toggles on and off the specular effect on the drawn objects (spheres, cylinders, etc.).
– Track: enables track mode for the currently selected atoms. After selecting two atoms sequentially, their interatomic distance is tracked by activating this option. When three atoms are selected sequentially, the distances (in selection order) and the angle are tracked. When four atoms are selected sequentially, the distances (in selection order), angles, and the torsion angle are tracked. After the track mode is enabled, the selection can be modified and any change made with the edit mode is continuously tracked, and their values (distances, angles, and torsion angles) are updated in the bottom bar of MechaEdit window.
– Crop: activates the crop mode, in which a rectangular region of the drawing canvas can be defined before image rendering and export. It is useful for controlling the size and which part of the structure will be included in the saved image.
Drawing canvas
In the drawing canvas (Figure 11c), the structure can be rotated by holding the left mouse button and moving the mouse. The view can be translated by holding the right mouse button and moving the mouse. Individual atoms can be selected using Ctrl + left click, while a range of atoms can be selected by holding Ctrl and dragging with the left mouse button. Selected atoms can be deleted using the Delete key. Selected atoms can be hidden with Ctrl + H shortcut.
Side panel
The side panel (Figure 11d) contains a set of slide bars and buttons designed to intuitively modify the properties of the canvas elements (atomic properties, visual properties and canvas behavior). Besides, the included coordinates editor allows selecting and modifying the atomic coordinates individually. In addition, a frequency and frames listbox can be added to the side panel. The frequency listbox can be enabled/disabled from the tool menu. The frames listbox is automatically enabled if the opened file is a trajectory.
MechaKinetics
The MechaKinetics module accepts input data in JSON format, which defines the chemical reactions, temperature-dependent rate data, simulation time parameters, and initial species concentrations. The input file can be generated in the MechaData plotting interface (right-click and export reaction network) and customized as needed.
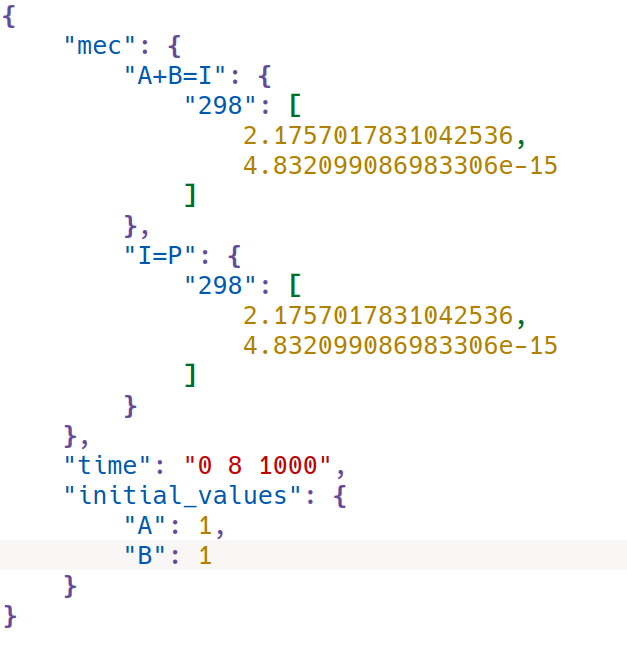
Figure 12. Input structure of JSON input file for MechaKinetics.
As shown in Figure 12, it has the following sections:
– Reaction Data: The “mec” field contains the chemical reactions and their kinetic parameters. Each key corresponds to a reaction, that is written in the general format “aA+bB=cC+dD”. Within each reaction, the rates are provided as a dictionary of temperatures (in Kelvin) and a list containing two numbers, e.g: “298”: [2.17, 4.83e-15]. The first number is the forward reaction rate and the second the reverse reaction rate (both in 1/s}), calculated using Eyring’s equation. Multiple temperatures can be included if the reaction rate needs to be evaluated across a temperature range.
– Simulation Time: The “time” field defines the time span (in seconds) for the kinetics simulation as a string of three values: “time”: “t_start t_end t_step”.
– Initial Values: The “initial_values” field defines the starting concentrations of reacting species, for example, “initial_values”: { “A”: 1, “B”: 1 }.
Here, A and B start with a concentration of 1 (in arbitrary units consistent across all species). All other species are assumed to start at zero unless explicitly specified.
The user is encouraged to see other examples of these input files in the examples folder of the source code, such as rn.json and reaction_network_0tboh.json.